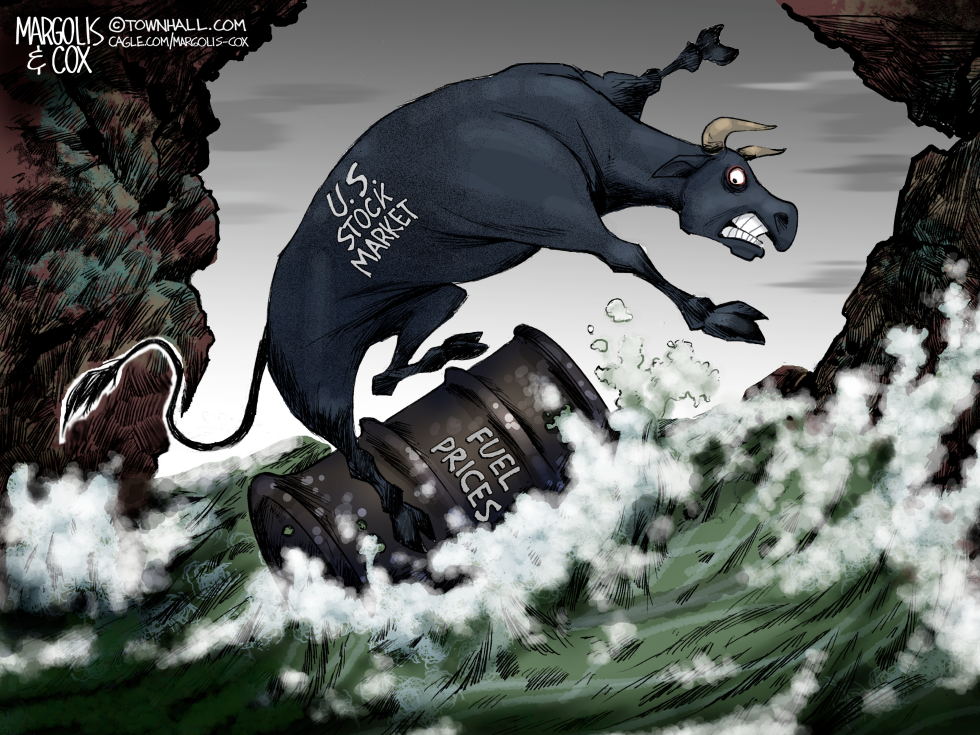
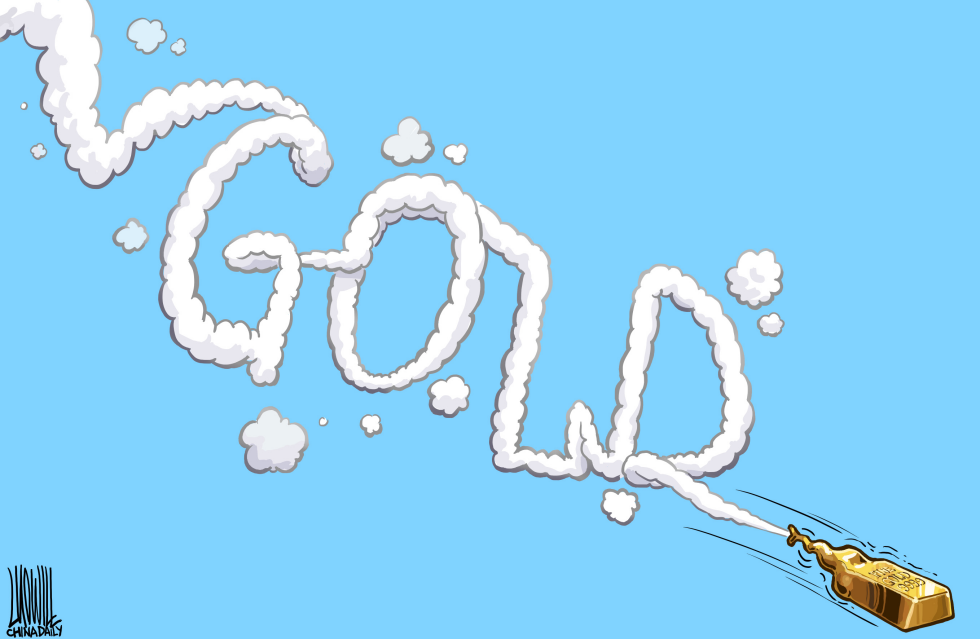
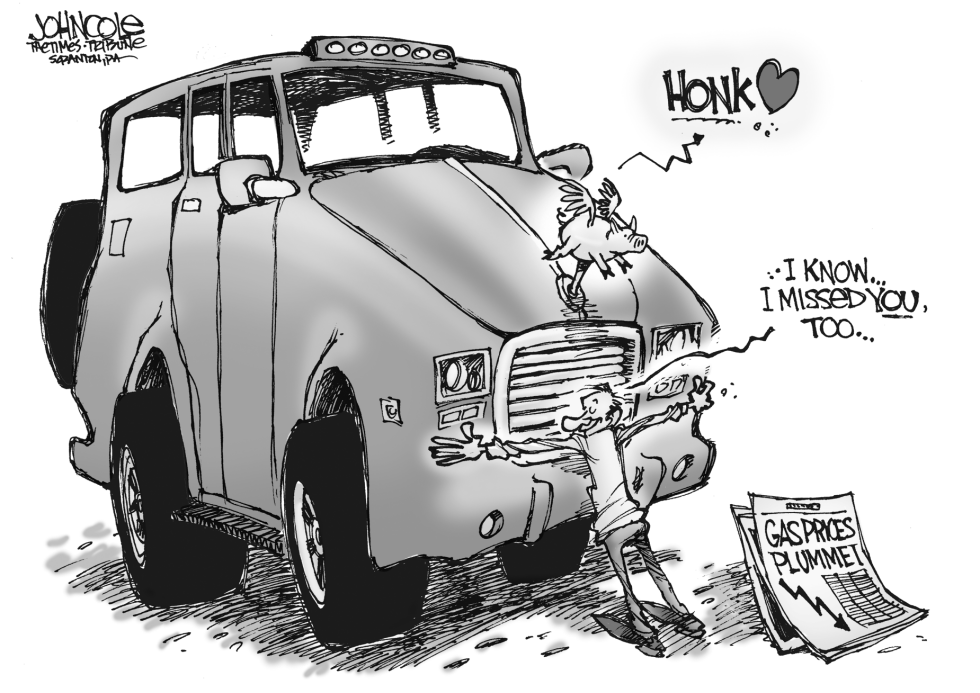
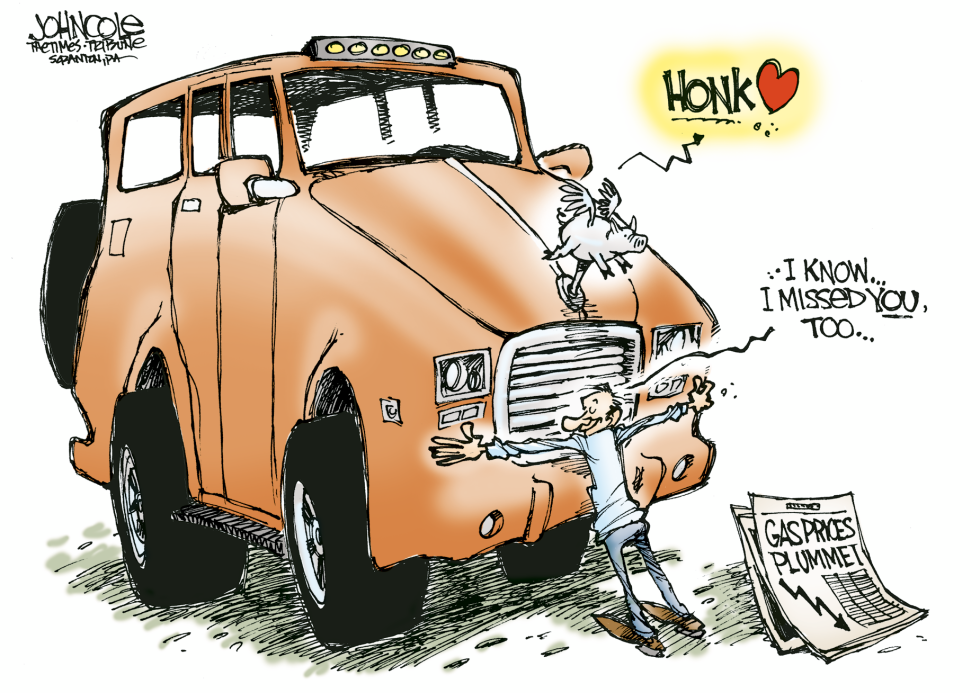
The cartoon shows a fierce black bull, emblazoned with 'U.S. Stock Market,' plummeting off jagged cliffs into a turbulent green sea where an oil barrel labeled 'Fuel Prices' tips over amid white foam. This visual packs a punch on how rising fuel prices can drag down the bull market, touching on economy, stocks, oil, prices, portfolio, and market tags. It's a classic setup: the bull charges ahead but hits the wall of energy costs, splashing into chaos. Editors see these often, where financial optimism meets harsh commodity realities, making it relatable for readers watching their investments swirl in the currents.
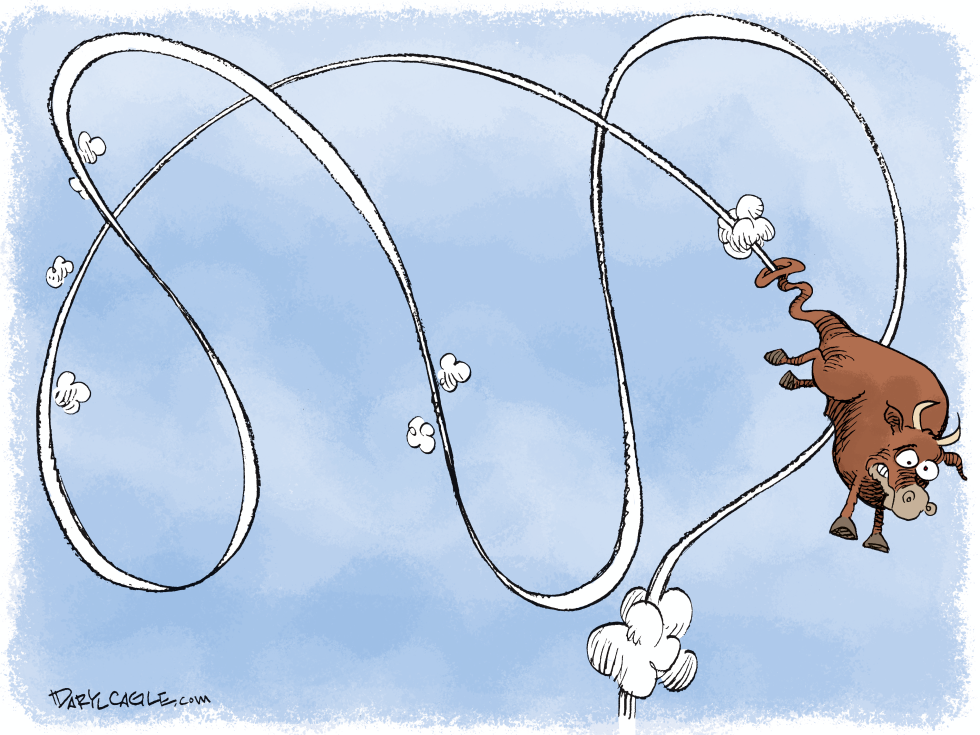
The cartoon depicts a brown bull figure losing air and dangling from a twisting white line dotted with cloud-like puffs. The line evokes a stock market graph that has turned downward. Published on September 24 2022, the image aligns with ongoing market volatility and investor concerns over falling prices in major indices during that period.
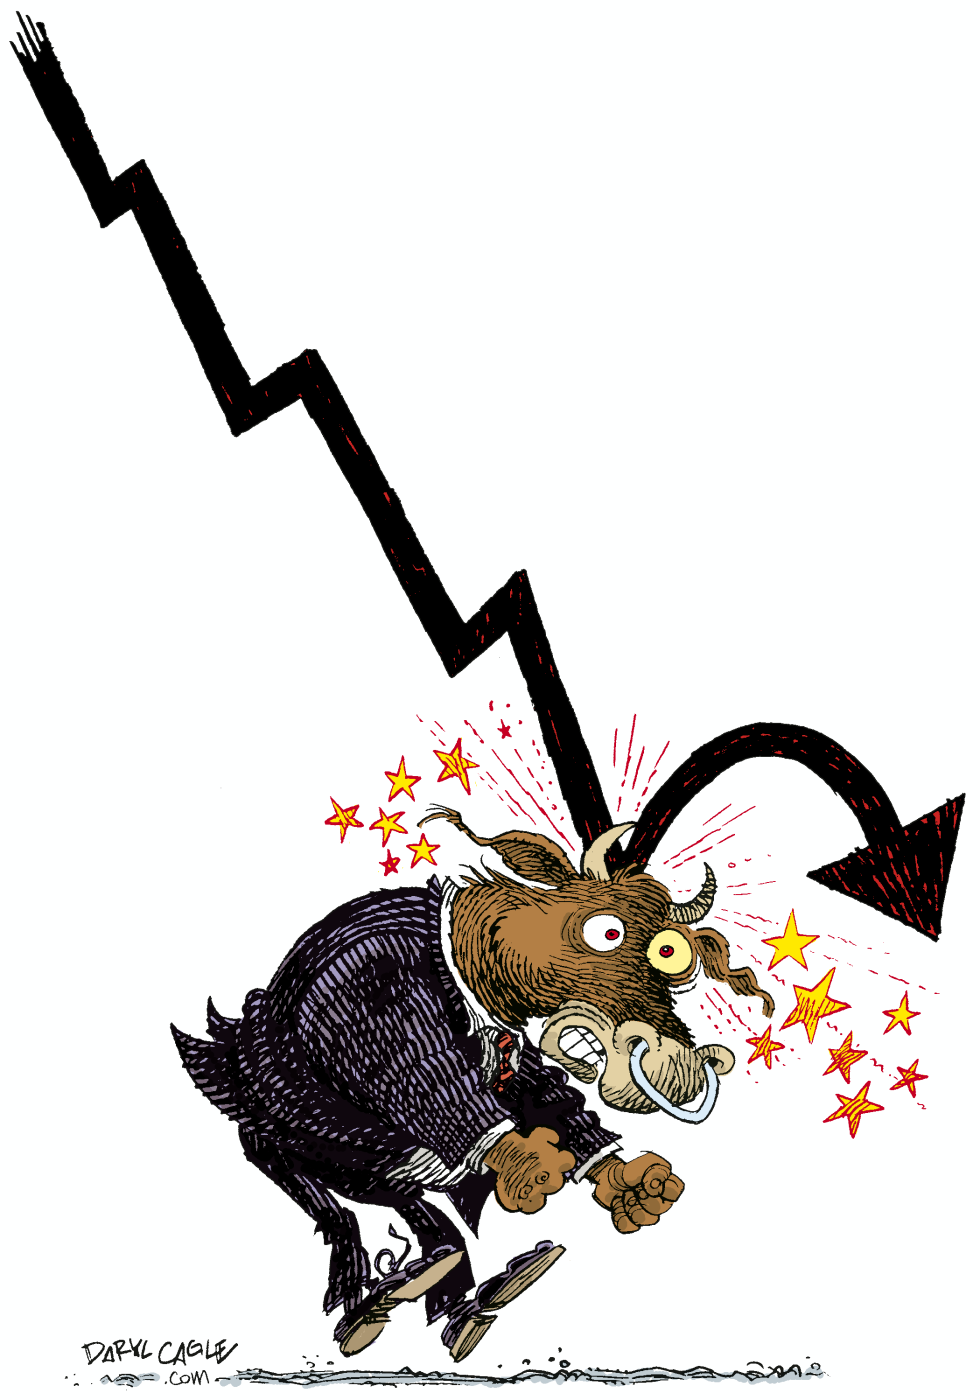
A suited bull representing Wall Street reels from a massive downward arrow on September 24 2022. The jagged line traces a steep decline in major indexes including the Dow and S&P 500. Red impact lines and scattered stars emphasize the sudden drop in stock prices and investor holdings.
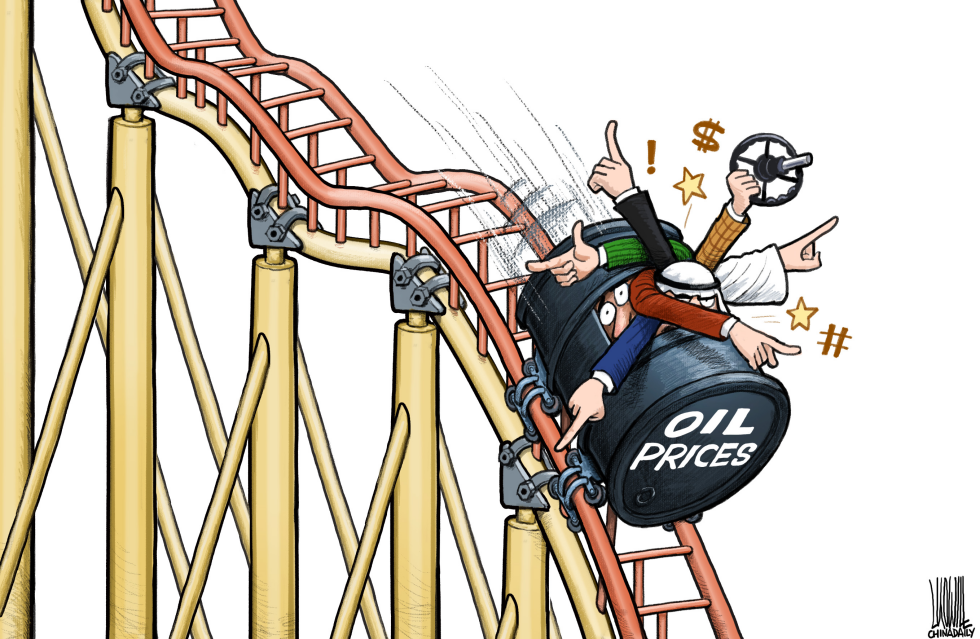
Luojie's 2016 cartoon captures the fall of oil prices through a roller coaster metaphor, where a barrel labeled 'OIL PRICES' hurtles down steep tracks. Arms clad in various attires—suit sleeves, keffiyeh, plaid shirt—stick out, gesturing wildly with thumbs up, pointing fingers, and a steering wheel. Exclamation points, dollar signs, stars, and hash marks fly around, emphasizing the turmoil. This image tags oil, price, fall, roller coaster, and oil producing countries, illustrating the volatile ride of global energy markets in a straightforward, humorous jab at economic instability.
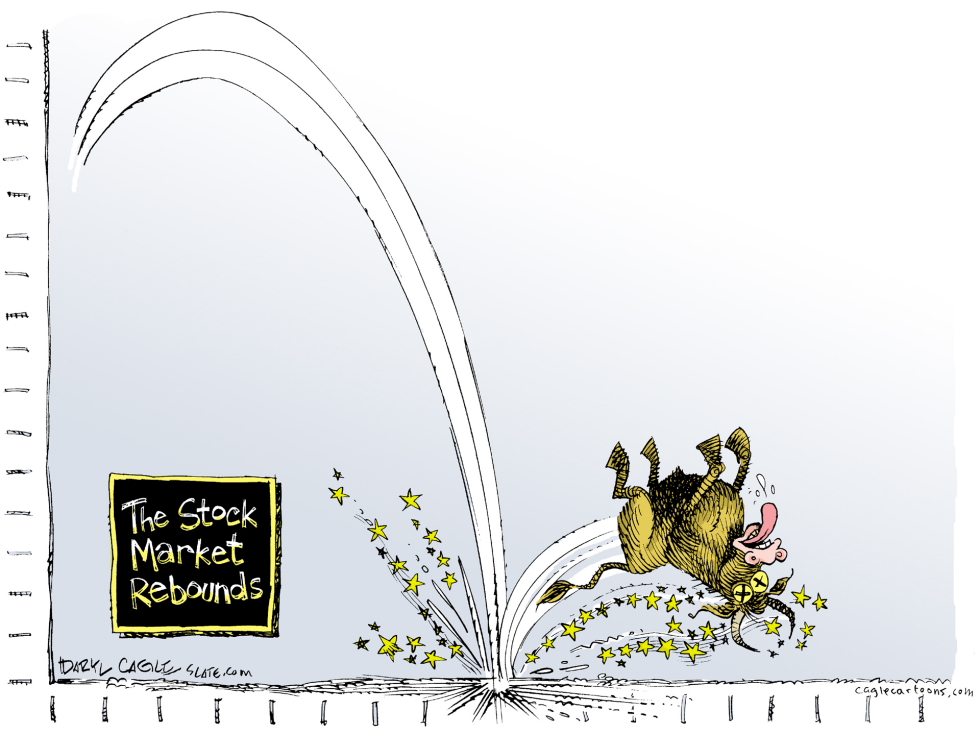
The cartoon depicts a brown bull with dollar sign eyes tumbling yet rebounding from the ground amid yellow stars. A black sign states the stock market rebounds. Curved graph lines on the left suggest a market trajectory. The image from July 2002 captures market dynamics following earlier declines.